TradingKey - Lennar starts off with a Sept. 15 closing of $80.07, verified vs. $80.11 reference. The stock recently recovered from $76.72, but still remains below $80.47-$80.73 former support, now turned resistance. The most crucial point on the calendar for today is the Fed decision and the Lennar fiscal Q3 earnings are after the U.S. closing. The main question is whether the combination of lower construction costs and falling incentives will offset the high mortgage rates and support home selling gross margin in the 16% range.
Q3 Earnings Are a Margin Test, Not Just an EPS Test
Wall Street is looking for $1.28 EPS and $8.3 billion in revenue, a steep drop from last year’s numbers. Analysts are looking for almost 20,960 deliveries, 21,473 new home orders and a 15.9% home-sale gross margin.
I find the margin as the most important figure. Lennar anticipated a 16% home selling margin for the new fiscal quarter along with deliveries in the range of 20,500-21,500 and an ASP in the range of $375K-$380K, as well as SG&A of 8.8%-9.0%.
A result of 16% or more would reinforce the view that the margin has bottomed. Below that level would indicate that the recent increases in mortgage rates have neutralized the benefit of lower costs.
Incentives Remain the Critical Operating Variable
Lennar used significant levels of mortgage-rate buydowns and other incentives to address affordability. The Q2 incentives average was around 12.9% vs. 14.1% in Q1 and 14.5% in Q4.
An encouraging trend, but 12.9% still hovers significantly above the 4%-6% described as more normal by management.
A gradual decline toward 11%-12% is positive for margins, a return toward 13%-14% (or more) would likely continue to impact gross margins which could keep margins depressed.
Mortgage Rates Remain the Biggest External Headwind
Since Lennar released its Q3 guidance, the housing market has deteriorated. Today, the 30-year mortgage rate is approximately 6.85% and the U.S. 10-year Treasury has hovered around 5%.
For Lennar’s first-time or entry level buyers, the mortgage payment is more pertinent to the purchase price than the published price. Therefore, even lower construction costs may not fully offset the affordability pressure from higher monthly mortgage payments.
The broader housing market also has not recovered. Even with home prices only expected to increase slightly, builders do not expect housing sales will rise either. Additionally, the survey of builders shows poor sentiment.
Today’s Fed Decision Adds a Second Catalyst
The Fed decision comes before Lennar's, and the markets are definitely leaning in on pricing a 25-basis point increase to 3.75%-4.00%.
The direct fed funds rate doesn’t correlate to mortgage rates, but the reaction of the bond market will be critical to homebuilders. If the decision pushes the 10-year Treasury above 5%, that will likely offset most of the good news in the Lennar report. However if long yield retreat, stock may receive first aid even with high mortgage rates.
That makes today’s decision quite binary: the outlook for the housing market can actually change before management reports Q3 results.
Asset-Light Strategy Is Lennar’s Main Structural Advantage
The best part of the long-term Lennar story will always be their land strategy.
Lennar has almost 98% of their homesites controlled rather than owned, thus decreasing their land capex, inventory risk, and exposure to land market valuation write downs.
As reported in Q2, Lennar had $1.8 billion cash and no borrowing on their $3.1 billion revolver, with homebuilding debt to capital at about 15.8%.
At below book value, Lennar has significantly more flexibility than builders with large land inventories entering a cyclical downturn.
Construction Efficiency Is Improving
Lennar has lowered construction costs by around 13% throughout the last few years, and reduced cycle time to a new low of 121 days in Q2.
These efficiencies are great because every dollar of build cost reduction lessens the cost of incentives. Watch out construction cost per square foot and cycle times.
Improving both gross margins and incentives, coupled with stability within incentives, would allow recovery from a recessive mortgage rate environment.
If both recover while incentives stabilize, gross margins can recover even without a major decline in mortgage rates.
Buybacks Add Another Interesting Signal
During the second quarter of 2026, Lennar bought back 5 million shares for $447 million at an average price of $89.35. The stock closed at $80.07 a share the day of this report, a 10% drop from the average buyback price.
Should Lennar speed up buybacks despite the stock trading in the upper seventies and low eighties, this would show that management sees the value of Lennar stock as attractive in the long run, even with the difficult housing market.
Lennar Technical Analysis: $80.73 Is the Immediate Recovery Test
At the close on the 15th of September, LEN stock was trading at $80.07, just $0.04 from the $80.11 reference line. After a breach to the downside that took the stock to $76.72, LEN has traded back into the previous support zone of $80.47 to $80.73.
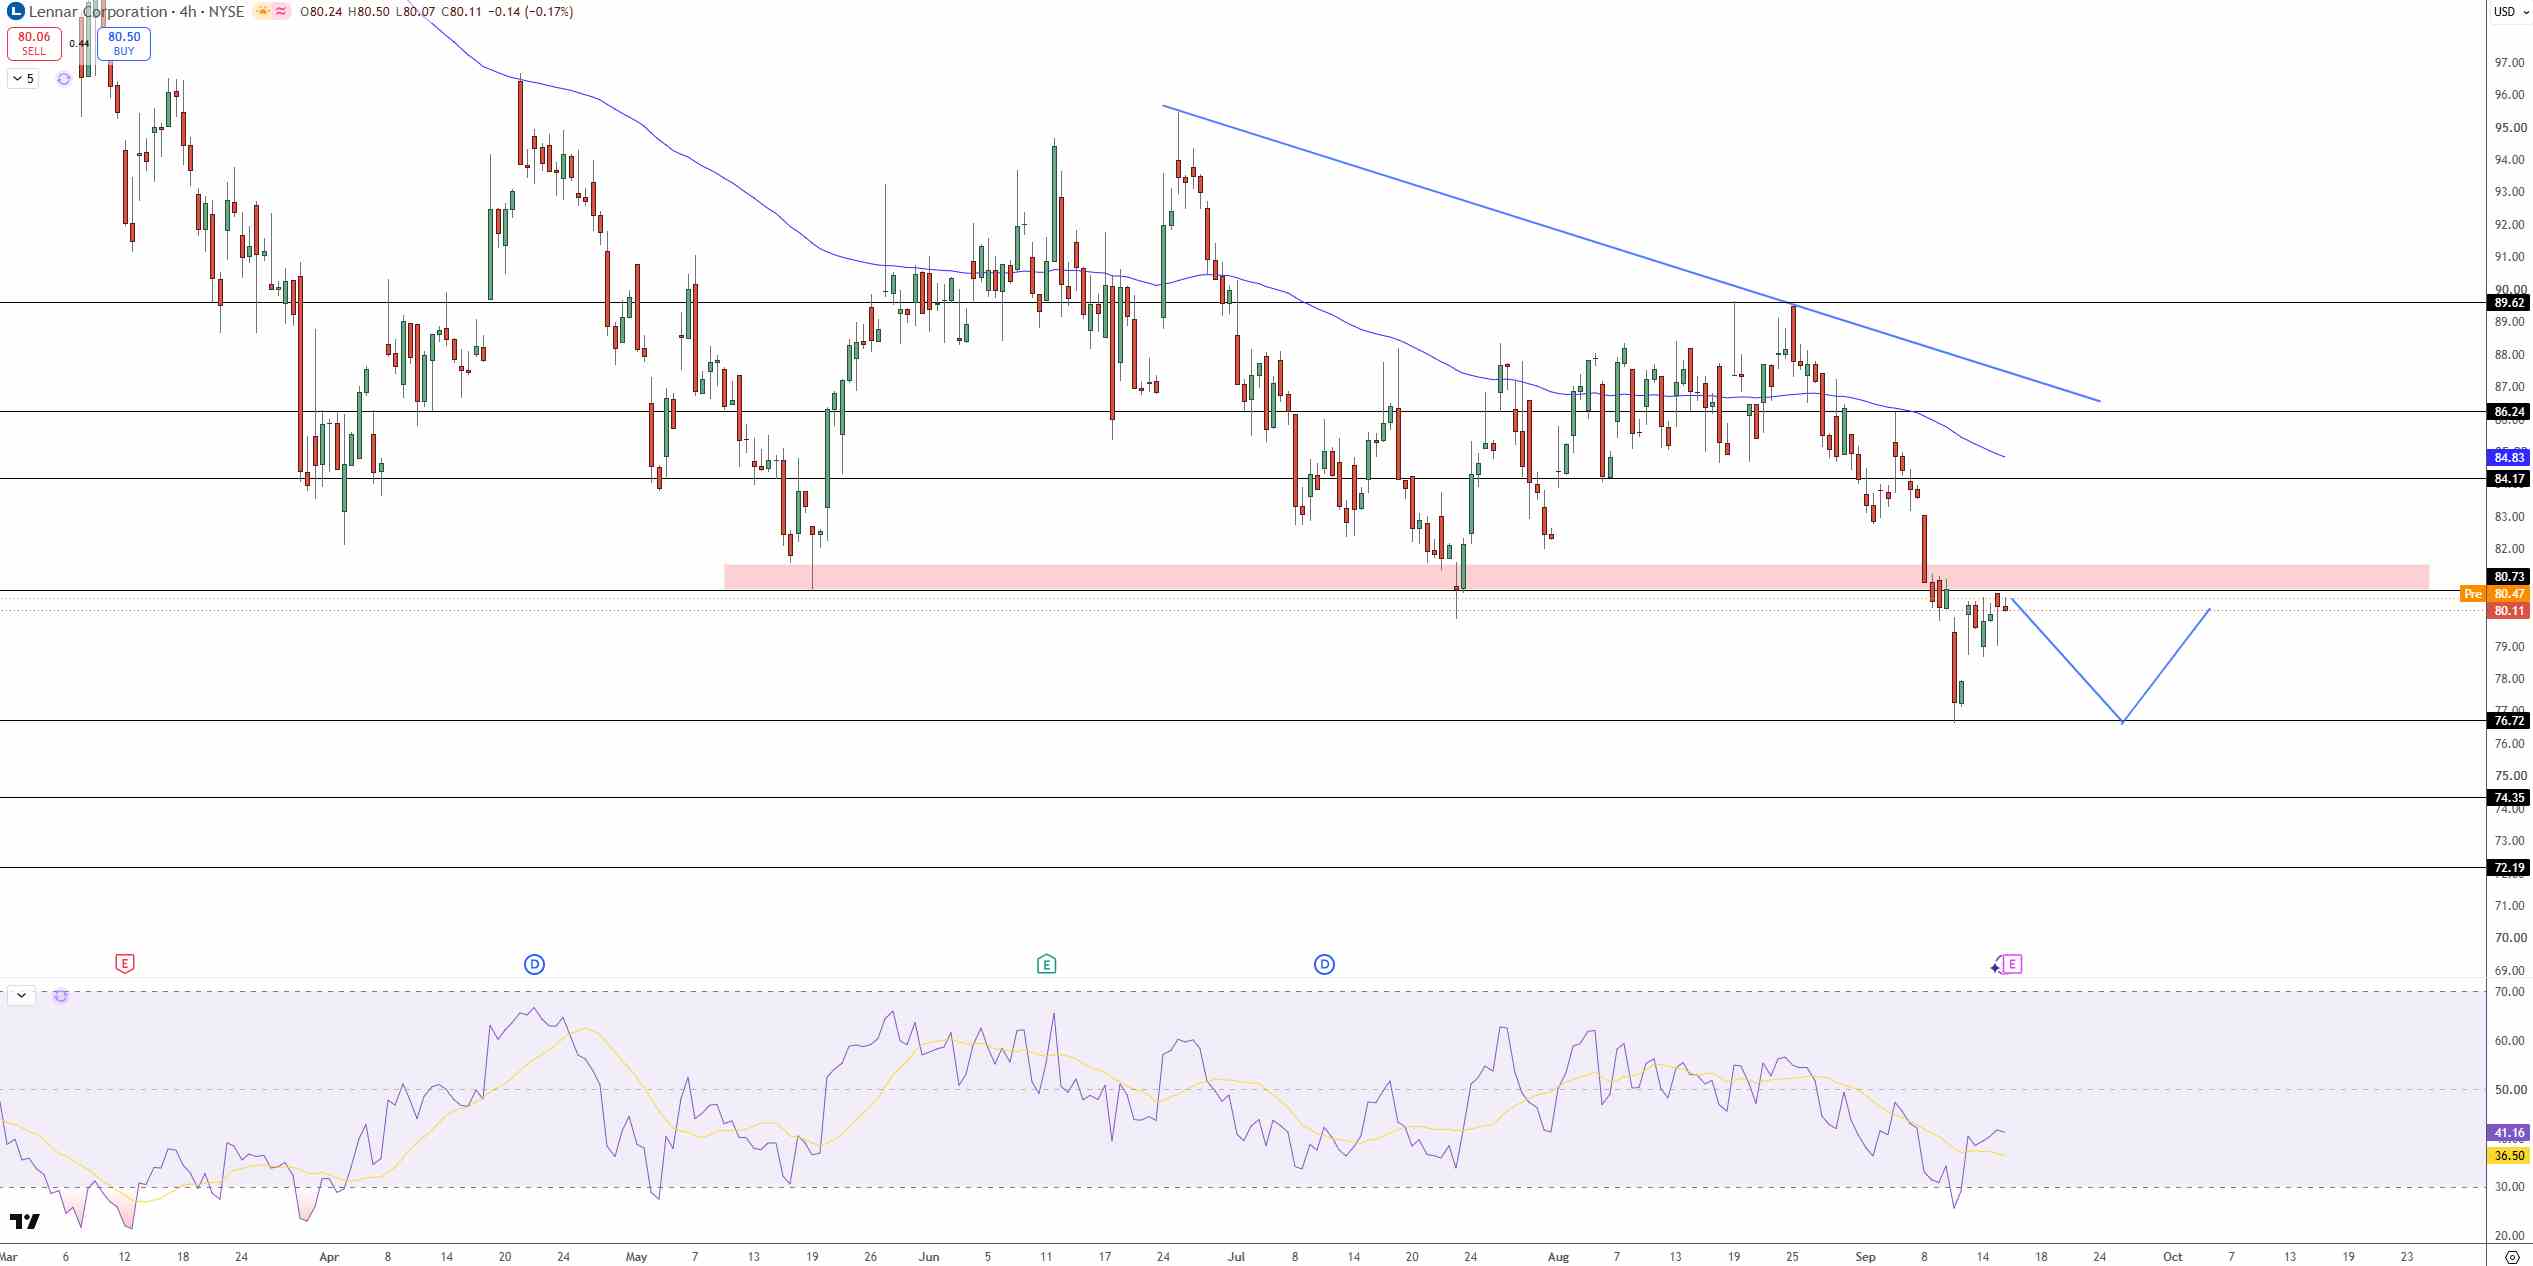
Lennar Stock Price Chart - Source: Tradingview
Until LEN closes above the moving average of $84.83, it will remain in a long term bearish environment. The recovery zone of $84.17 to $84.83 and the long-term resistance zone of $86.24 will come into play if the price closes above $80.73. A break of the trendline would lead to a large recovery to $89.62.
While RSI has recovered to around 41, above its signal line near 37 but still below 50, the indicator is showing that there is a lack of bullish momentum.
A rejection at $80.73 would bring further price drops to $76.72 and below that to $74.35 and $72.19.
Key Levels
· Latest completed close: $80.07
· Immediate resistance: $80.47-$80.73
· Moving average resistance: $84.83
· Recovery zone: $84.17-$84.83
· Higher resistance: $86.24
· Major upside target: $89.62
· First support: $76.72
· Secondary support: $74.35
· Deeper support: $72.19
· RSI: Around 41, recovering but still below 50
Why is Lennar stock in focus now?
Lennar reports Q3 after close along with the highly anticipated FOMC decision. Investors will largely ignore reported EPS and focus on whether Gross margin hits approx. 16%, given continued falling incentives, orders maintaining around 21,500, and management holding their delivered units at 82k-83k for the full year.
What level confirms a stronger LEN recovery?
A sustained 4-hour close above $80.73 will build on the rebound and target $84.17-$84.83, while a close below $76.72 will extend the bearish structure and expose $74.35 and $72.19
Bottom Line
The weight of execution improvements for Lennar is up against a still challenging housing market. The flexibility of the land model, coupled with the strong balance sheet, give more room for Lennar to grow, but the heavy incentives coupled with pressure on margins from near 7% mortgage rates makes for an increasingly difficult situation. With the Q3 report, investors will be focused on gross margin and incentives vs. orders, in the absence of any given EPS. Technically, I remain bearish below $80.73. A confirmed recovery above $80.73 would target $84.17-$84.83, while rejection there keeps $76.72 at risk.
Find out more