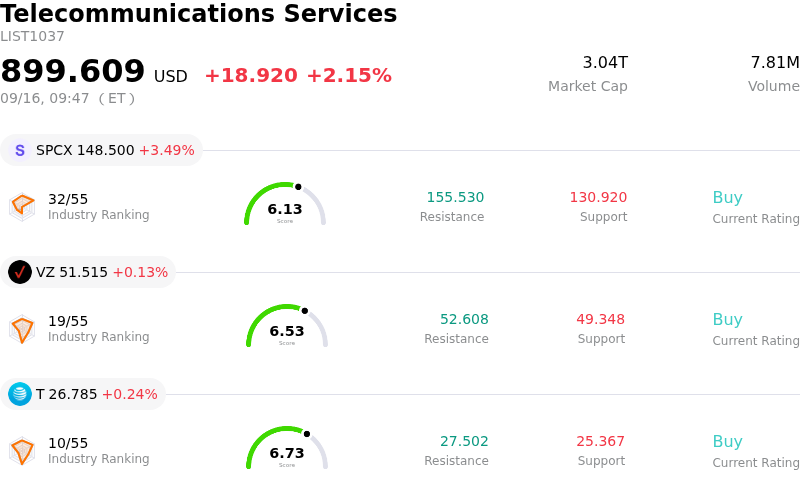
SpaceX (SPCX) opened up by 3.49%. The Telecommunications Services sector is up by 2.15%. The company outperformed the industry. Top 3 stocks by turnover in the sector: SpaceX (SPCX) up 3.49%; Verizon Communications Inc (VZ) up 0.13%; AT&T Inc (T) up 0.24%.
What is driving SpaceX (SPCX)’s stock price up today?
SpaceX demonstrated positive momentum alongside notable intraday volatility, primarily driven by major operational announcements and approaching structural milestones. Market sentiment gained traction following confirmation that the upcoming test flight for the Starship launch vehicle is scheduled for late September. As the vehicle targets its first orbital attempt to deploy next-generation Starlink satellites, investor confidence in technical execution and launch frequency has significantly improved. This operational catalyst underscores progress in expanding high-capacity global connectivity and orbital payload capacity, encouraging renewed institutional buying.
Compounding this upward pressure is the anticipation surrounding an upcoming rebalancing of the Nasdaq-100 index. Structural index adjustments are set to noticeably increase SpaceX's weighting within benchmark portfolios, prompting passive fund managers and exchange-traded products to absorb significant share volume. This expected wave of passive institutional inflows has created favorable short-term supply and demand dynamics. Although potential supply increases from upcoming lockup expirations continue to introduce trading friction, the mandatory portfolio realignments by passive managers remain a primary catalyst supporting price action.
Longer-term valuation narratives are also benefiting from strategic initiatives beyond core launch activities. Institutional investors are closely watching expanding commercial offerings, including orbital return services and plans to deploy space-based artificial intelligence hardware. While elevated capital expenditures on AI compute infrastructure and ongoing development costs keep valuation multiples rich and prompt periodic intraday swings, market participants are currently prioritizing top-line expansion, market dominance, and new revenue streams over near-term profitability concerns.
Technical Analysis of SpaceX (SPCX)
Technically, SpaceX (SPCX) shows a MACD (12,26,9) value of 0.296, indicating a buy signal. The RSI at 55.361 suggests neutral condition and the Williams %R at 39.181 suggests buy condition. Please monitor closely.
Fundamental Analysis of SpaceX (SPCX)
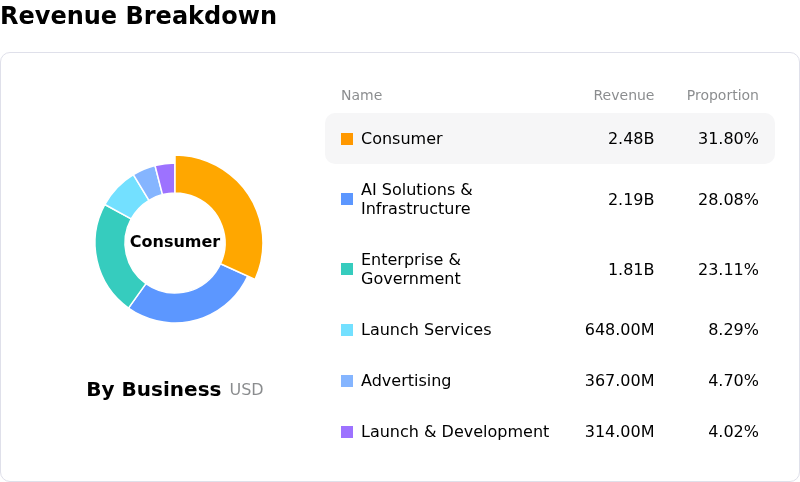
SpaceX (SPCX) is in the Telecommunications Services industry. Its latest annual revenue is $18.67B, ranking 10 in the industry. The net profit is $-4.94B, ranking 61 in the industry. Company Profile
Over the past month, multiple analysts have rated the company as Buy, with an average price target of $231.91, a high of $800.00, and a low of $100.00.
More details about SpaceX (SPCX)
Company Specific Risks:
- Aggressive AI Infrastructure Capex Surge: SpaceX reported a 550% surge in Q2 capital expenditures to $18.37 billion—bringing 1H 2026 AI spending to $23.6 billion—raising institutional concerns regarding severe free cash flow burn and ongoing capital intensity.
- Extreme Valuation Multiples and Net Losses: Trading at a Price-to-Sales (P/S) ratio exceeding 85x while generating ongoing GAAP net losses, SPCX carries an inflated valuation that leaves virtually no buffer against market multiple contraction or operational delays.
- Critical Execution Risk Surrounding Upcoming Starship Orbital Launch: Ahead of Starship's planned September 22 flight to attempt its first orbital deployment of Starlink V3 satellites, extensive hardware and software modifications implemented following prior test anomalies create high binary execution risk.
- Insider Share Restructuring Supply Overhang: SEC Form 4 filings revealed director Antonio J. Gracias executing a Rule 10b5-1 distribution plan involving over 42.7 million Class A shares, triggering potential supply overhang and secondary market volatility.
Find out more